Keep.✨SWE.🔥Soft.💩
Welcome to my little corner of the internet. Check out my Atoms for some casual life posts and informal brain dumps.
Projects • Writing • Misc
Build
I like tinkering
Some recent stuff I have been working on.
nextjs-components
waypoint-plugin-nixpacks
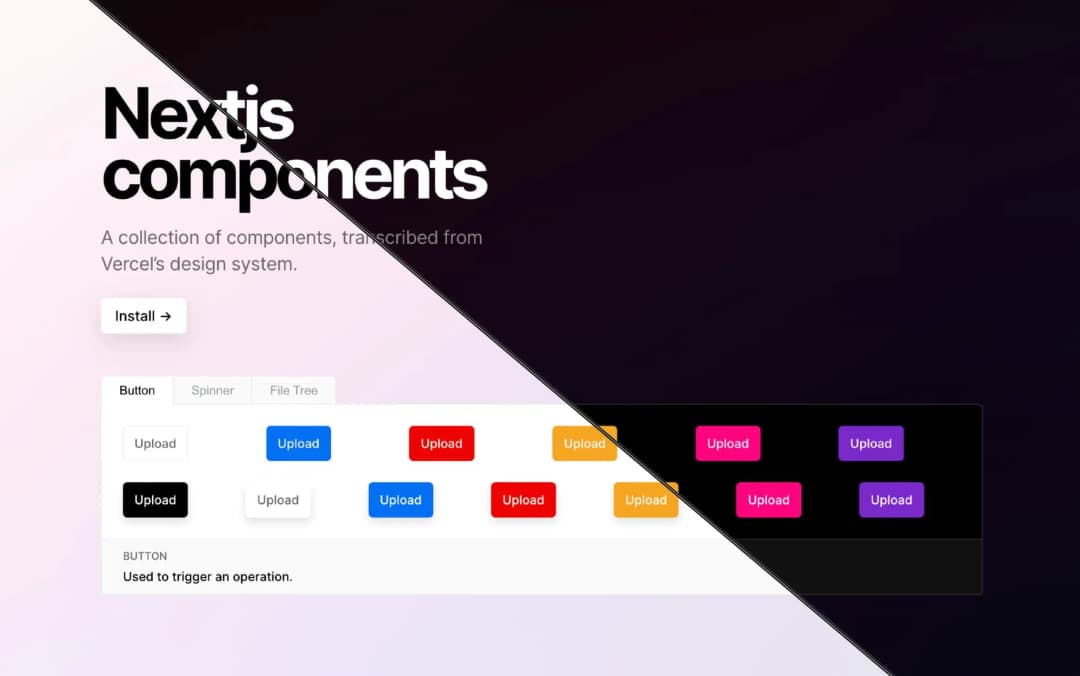
nextjs-components
A collection of React components, transcribed from Vercel's internal design system. 145
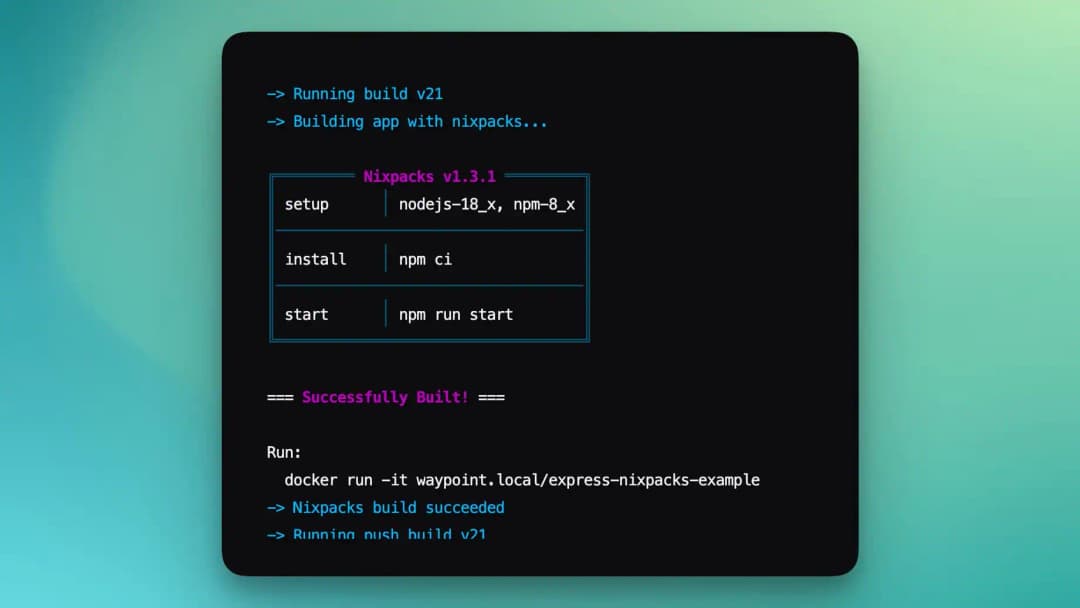
waypoint-plugin-nixpacks
A HashiCorp Waypoint plugin to build OCI images using nixpacks. 10
terraform-provider-pinecone
A Terraform provider to manage your resources on Pinecone.io 3
Publish
I do my best to journal
I’m a firm believer that the physical act of writing helps to ingrain knowledge... I should do it more...