Hexagonal Geospatial GPS Data Visualization App
Using Uber's H3, React Native, and DynamoDB to build a serverless system, end-to-end, to track and visualize my own GPS locations
Kevin Wang
One day, I had a burst of inspiration / creativity...
Zenly — a realtime social map — has always stricken me as a simple, fun, yet technically interesting app. Looking at it, I started to question how it was accomplishing what it does. In my head I thought, geospatial timeseries data... and I set out to learn a bit more, and build something.
Writing these blog posts always feels difficult for me. The nature of reading a document is very unidirectional, yet the actual process of the project that I'm writing about usually consists of multiple smaller parallel and bidirectional efforts (progression, regression, iteration) — basically controlled chaos.
Is geospatial timeseries data actually a thing?
This was an intial question I had, to which I received a response from some accomplished engineer:
@Kevin yes it's a thing
it's actually an interview question that I was given when I interviewed at uber like
4ish years ago
5 ish
i dunno
basically they asked me to design a database that could hold these information but the interviewer was really junior and couldn't really articulate what they actually wanted
they kept going like "well what if you did it in mysql" and I was like "ok sure I'd use XYZ schema in mysql... but mysql is terrible for this so I'd rather use something else"
and they didn't understand my solution so they kept going back to mysql
...I was basically sold after the first sentence, so I set out to try to fit geospatial into my preferred database, DynamoDB.
Why DynamoDB?
I chose DynamoDB for several reasons:
- It's serverless — you pay for what you use
- It's fully managed — 0 maintenence
- It's built for hyper scale — Lyft uses it for a ride-tracking system that stores GPS coordinates for all rides
- I'd be using with several other AWS resources
- I enjoy using it
Fitting GPS data into DynamoDB
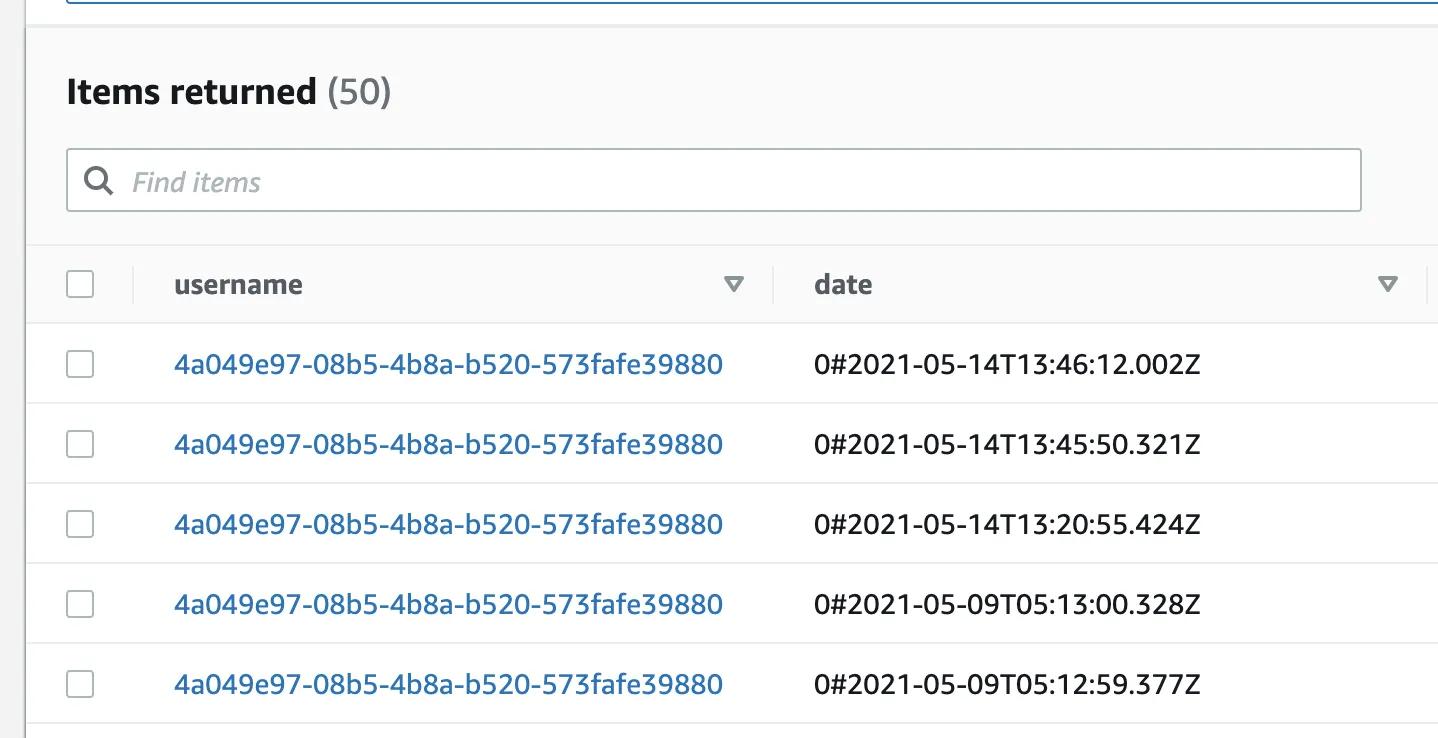
I knew right off the bat, my inputs would consist of at least "latitude", "longitude", "timestamp", and "username".
Depending on the query patterns, I'd be indexing on a few things like "username", "timestamp", and some other things that I learned about throughout my process.
This is how I defined my table with the CDK.
The two global secondary indexes came later down the road, when I wanted to support other query patterns.
Architecture
Here's a series of C4 diagrams that show the overall architecture of my project.
Additionally, I leveraged a few libraries to do the heavy lifting for me:
- uber/h3-js
- for lat/lng hashing and getting bounding vertices of a hexagon
- react-native-maps
- for visualization
- @react-google-maps/api
- for visualization
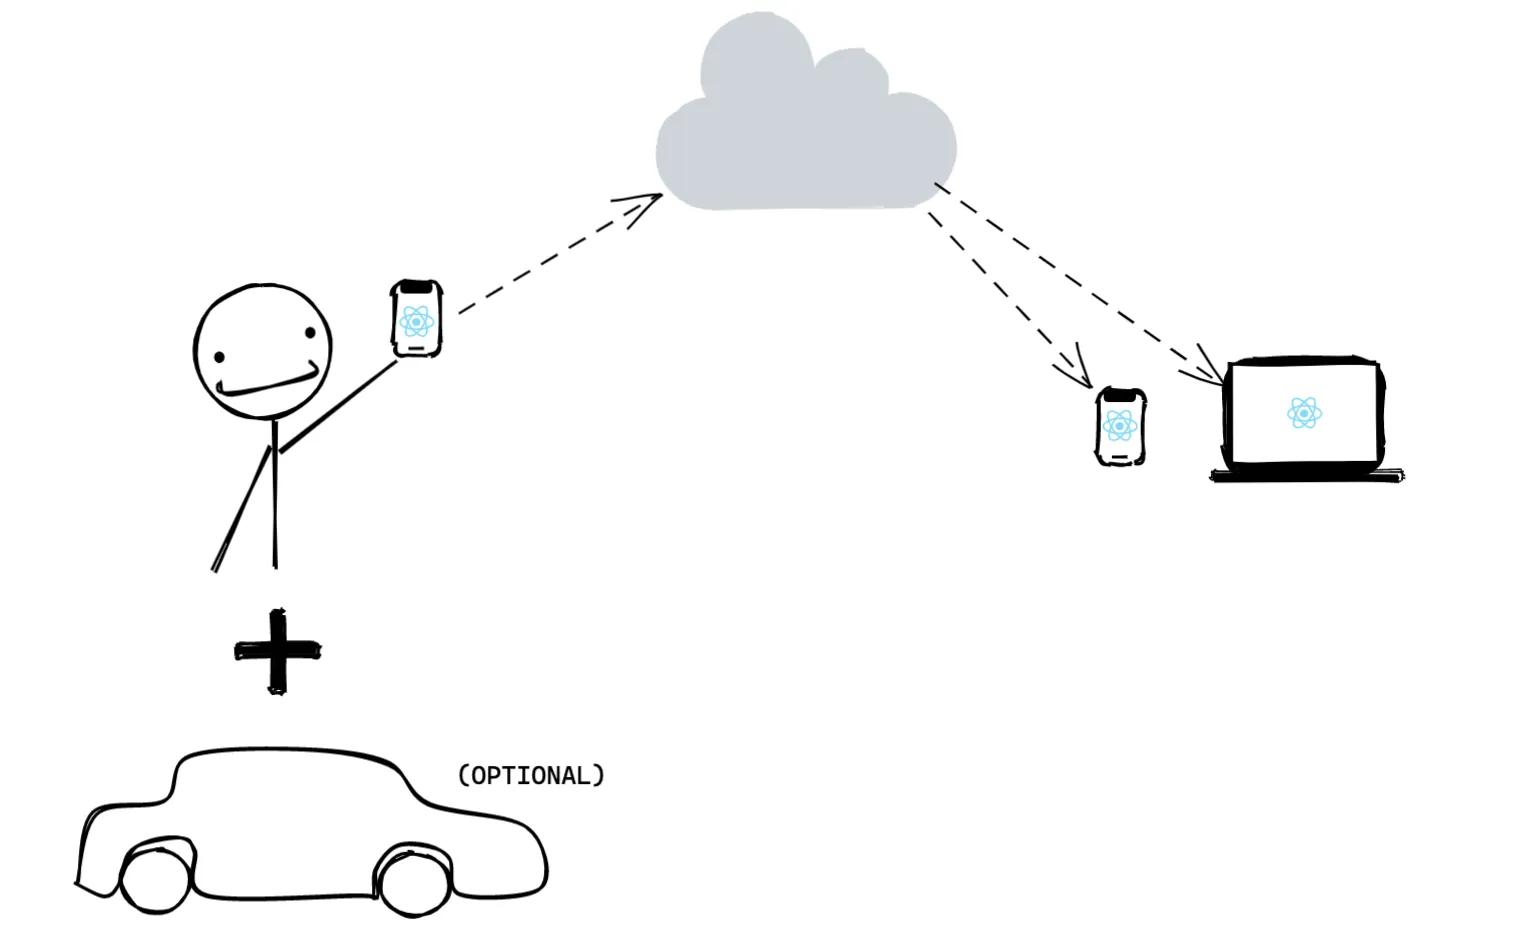
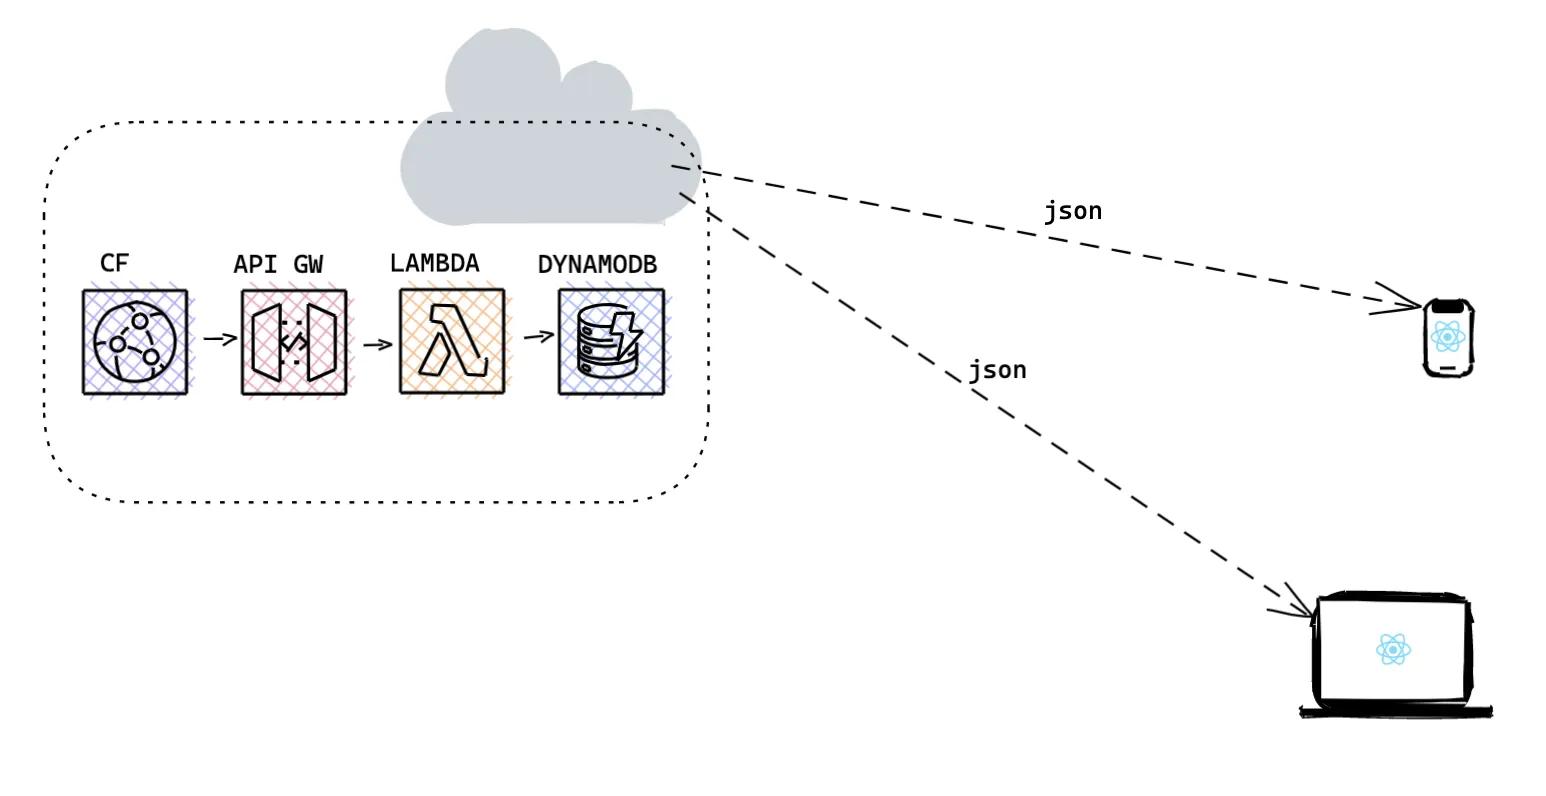
C1
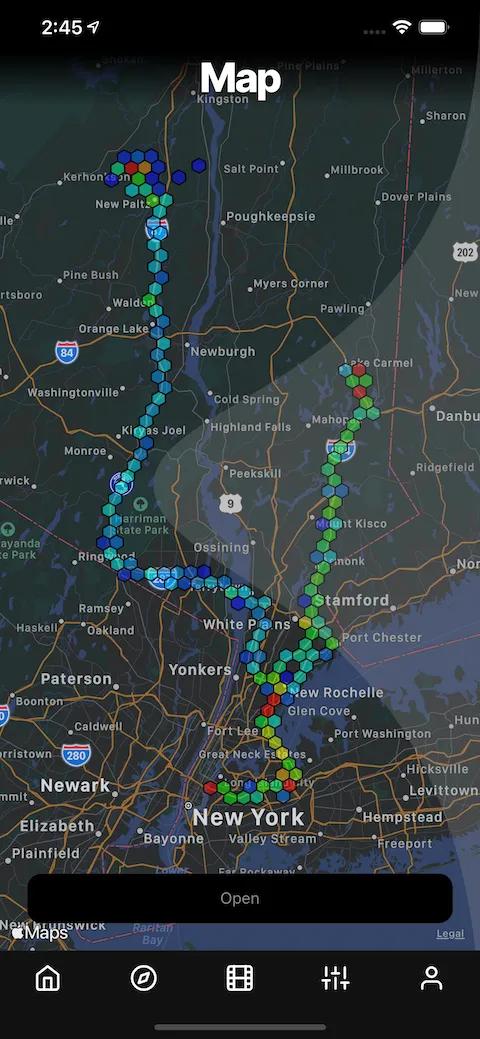
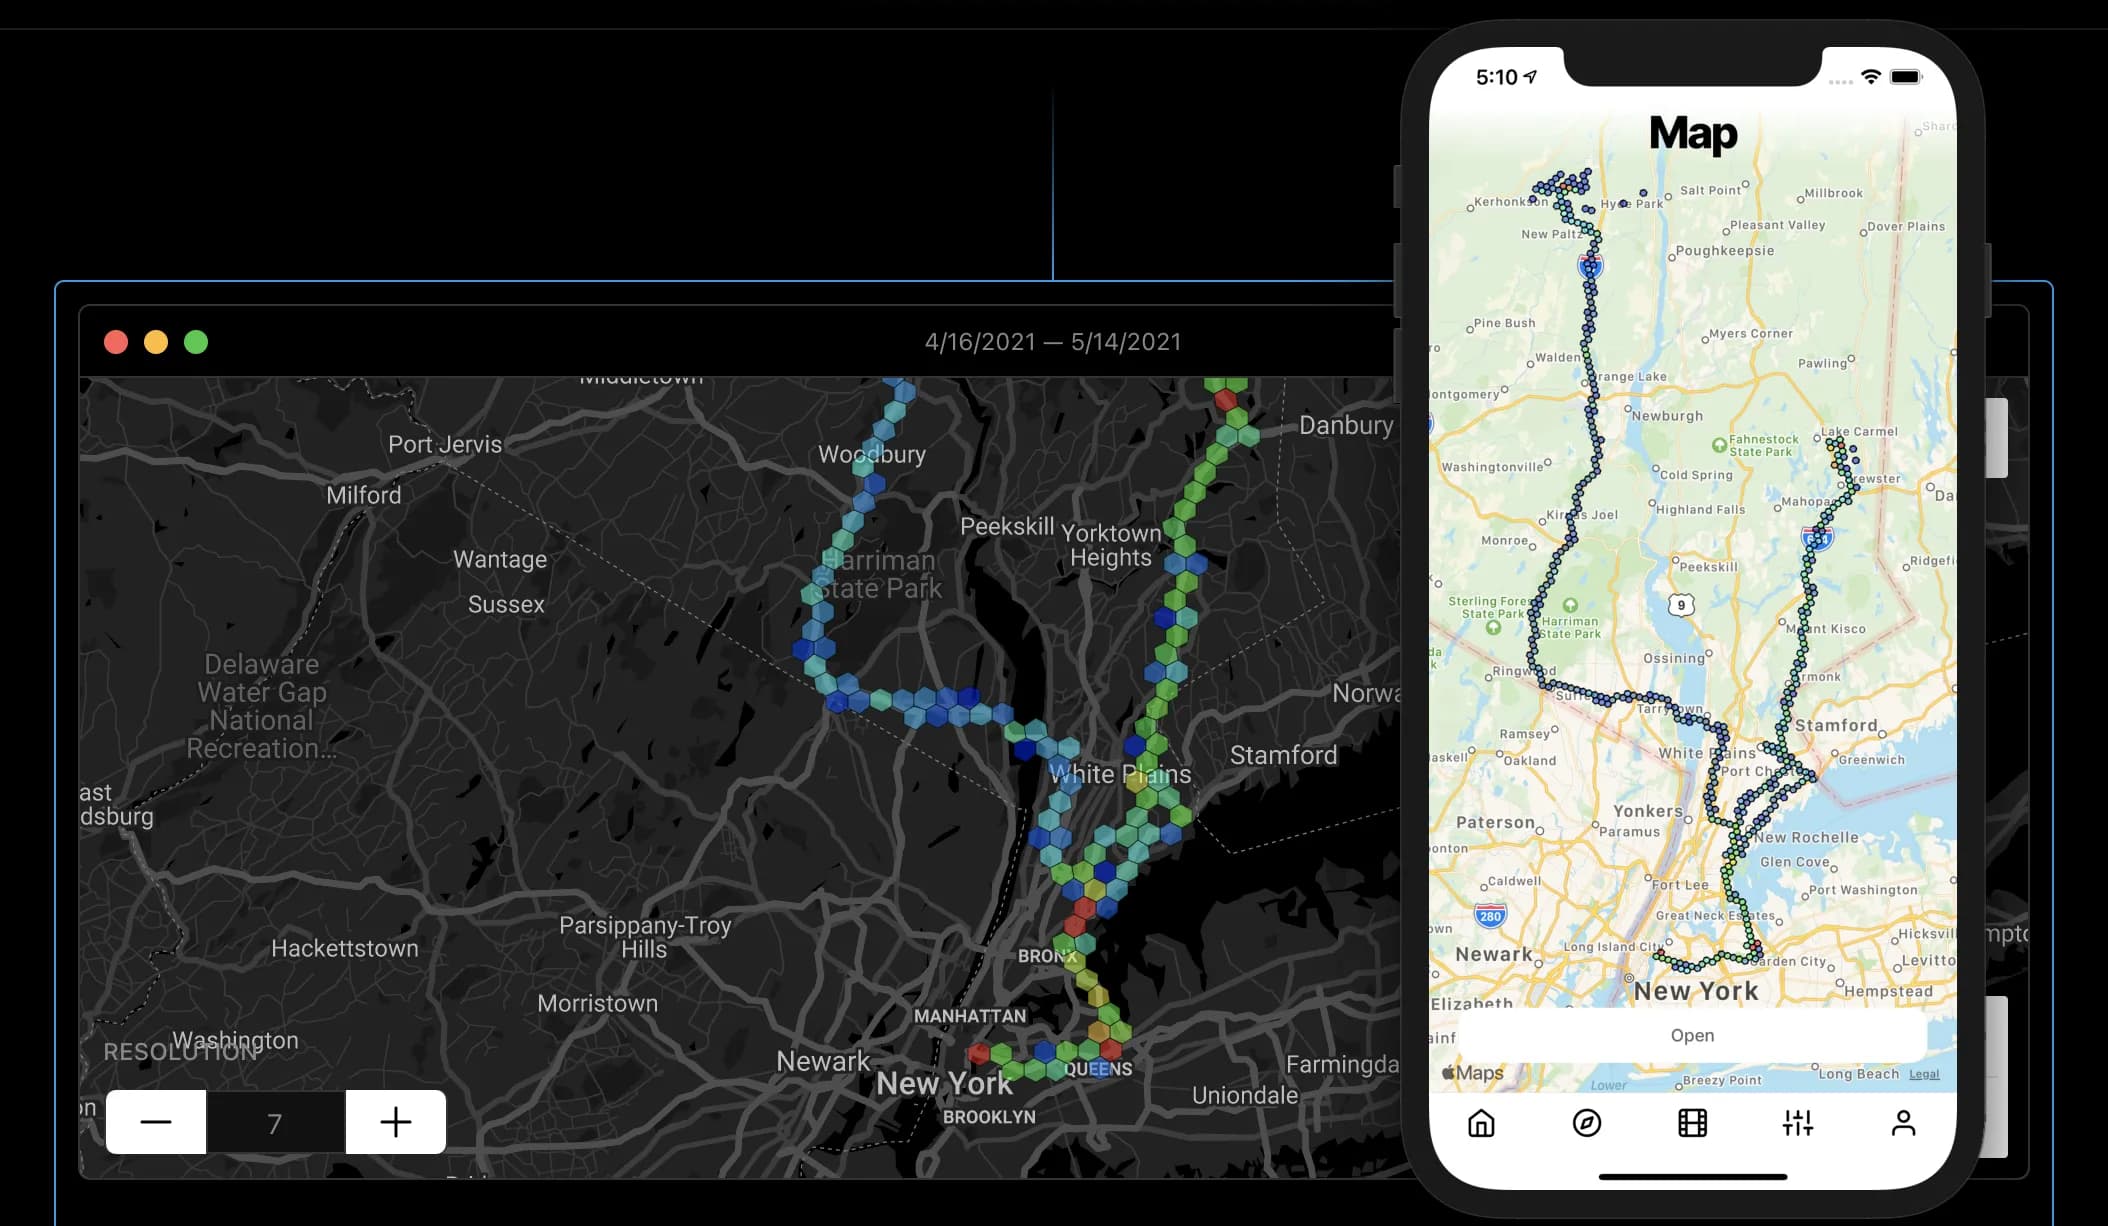
At a very high level, I created a few things. I created a serverless API to read and write GPS data to and from. I also created an iOS app whose native GPS functionality would be the source of GPS data. And finally I created two different map components (web and mobile) to organize and visualize GPS data as colored hexagons.
C2
Zooming in a bit, the app as well as the API Gateway require authentication through AWS Cognito. The backend is next to nothing, consisting of a single lambda function and a database.
The mobile app runs a background task to send GPS location whenever the device's location changes by X-meters. This is configurable.
I did some quick math:
- Given:
- Location updates trigger every 15 meters
- When:
- I'm sitting in a car going 70mph (31 meters/s)
- Then:
- I'd be calling the API 2 times every second
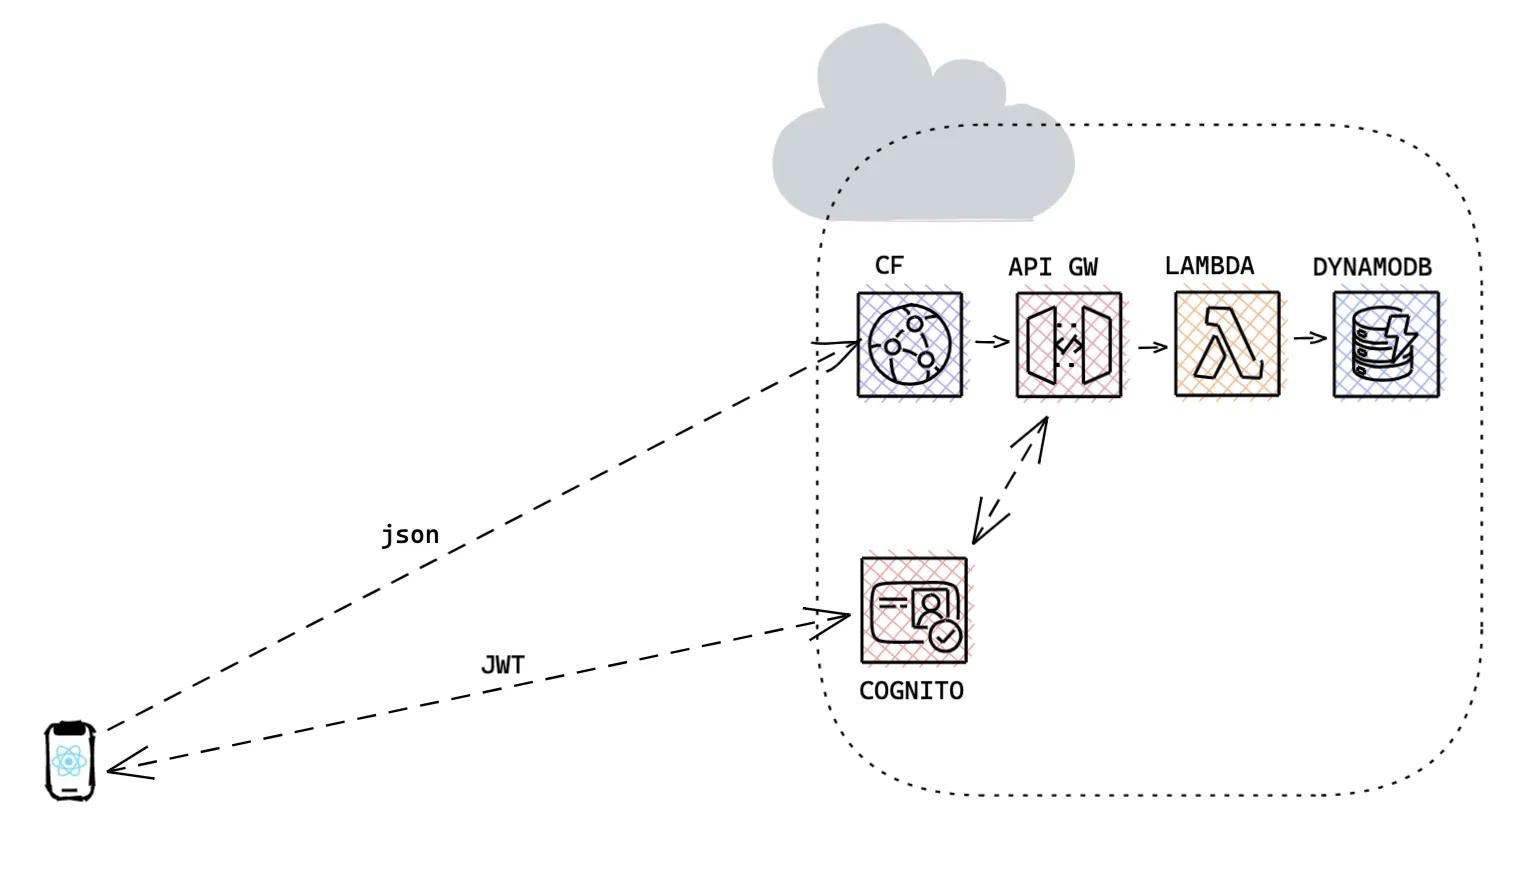
For reading data, which returns up to around 5,000 items, CloudFront serves as a CDN and cache to both deliver data with lower latency and to cut down on unnecessary reads against the database. The trade off here is eventual consistency when reading data but for this project, it's really not an issue.
C3
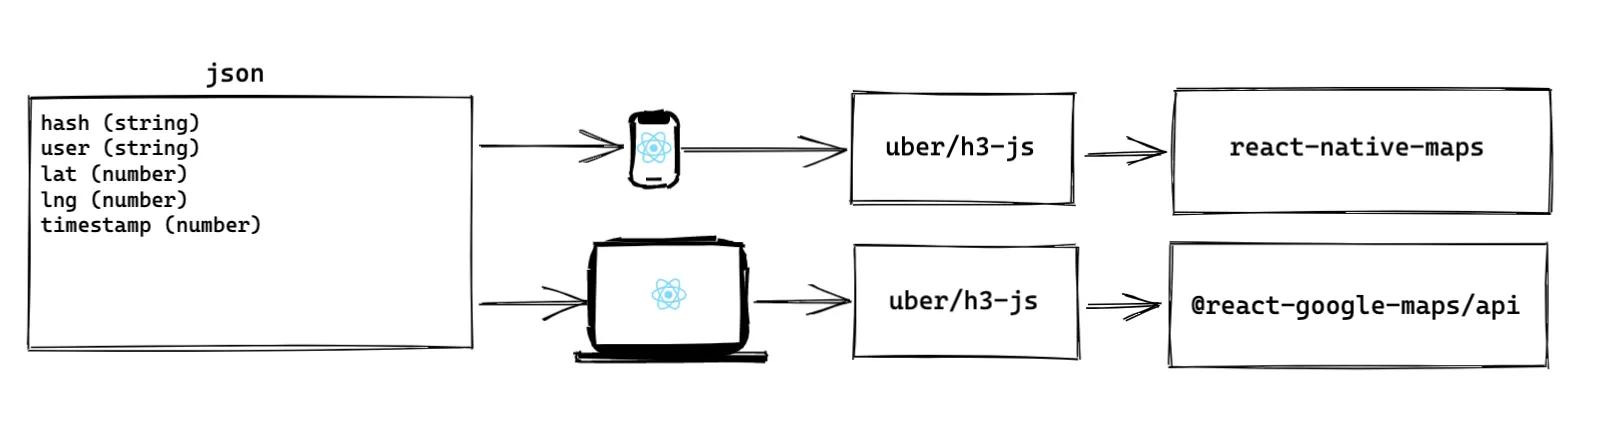
H3 is used both on the server and on the client.
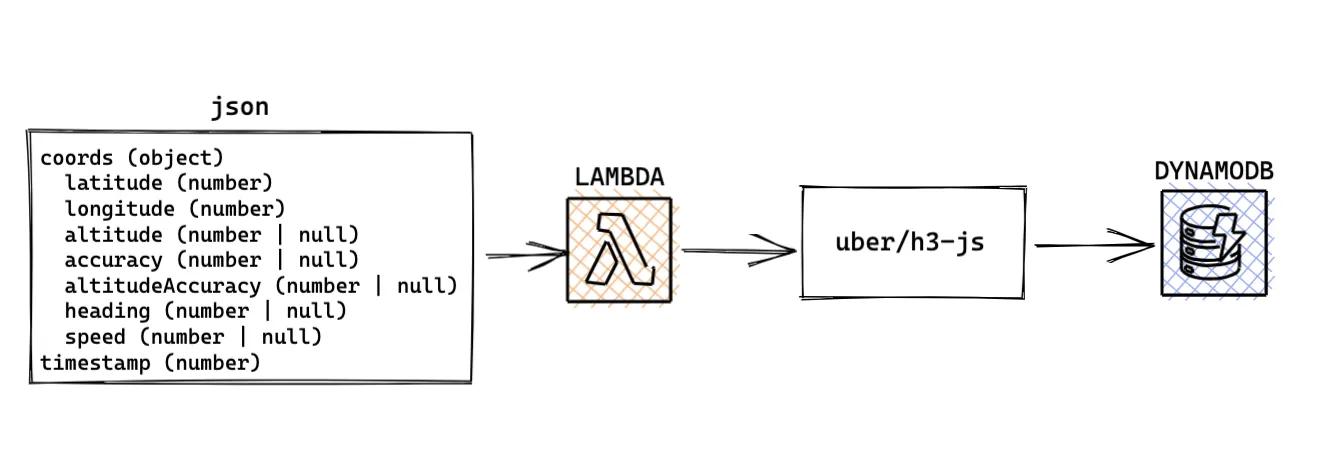
C4
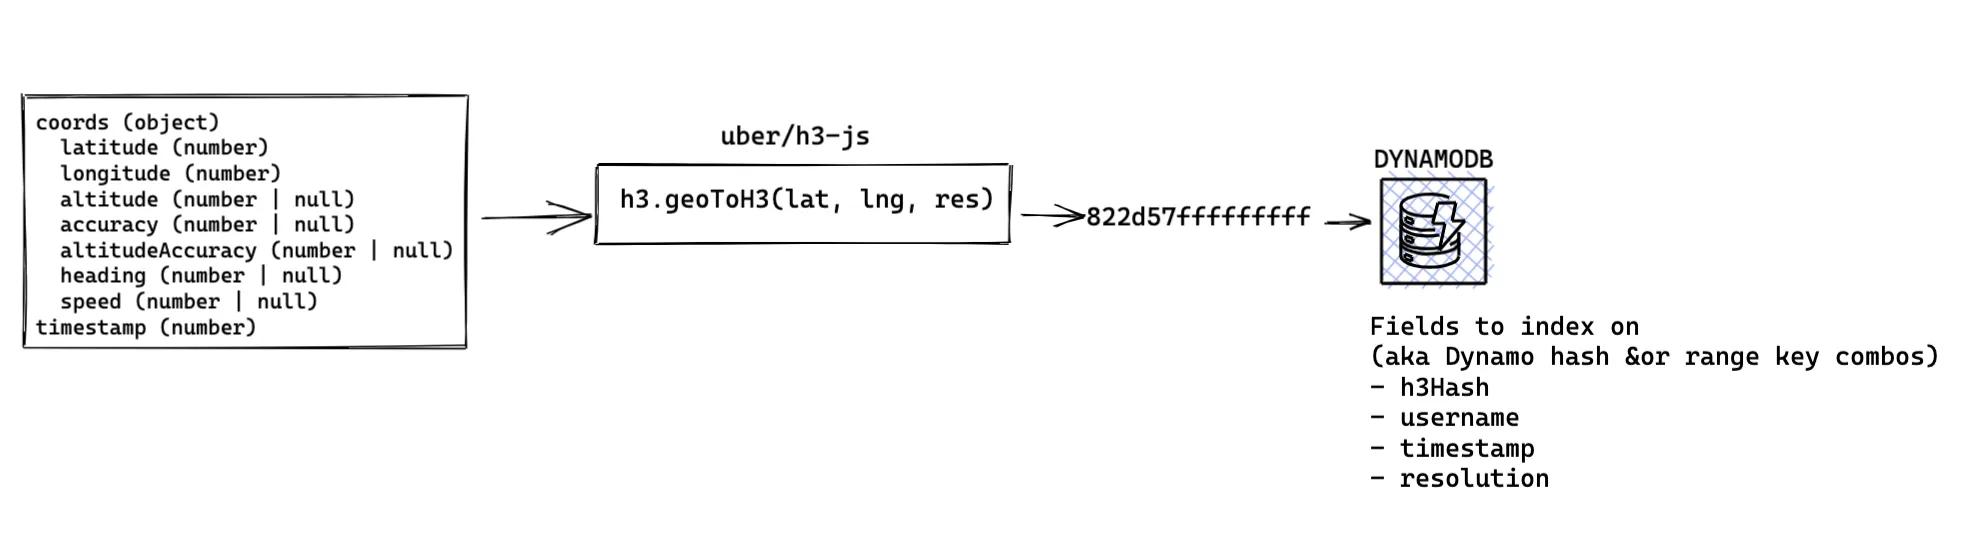
On the server, H3 creates a hash from latitude, and longitude, at a default resolution of 0 (the largest hexagons).
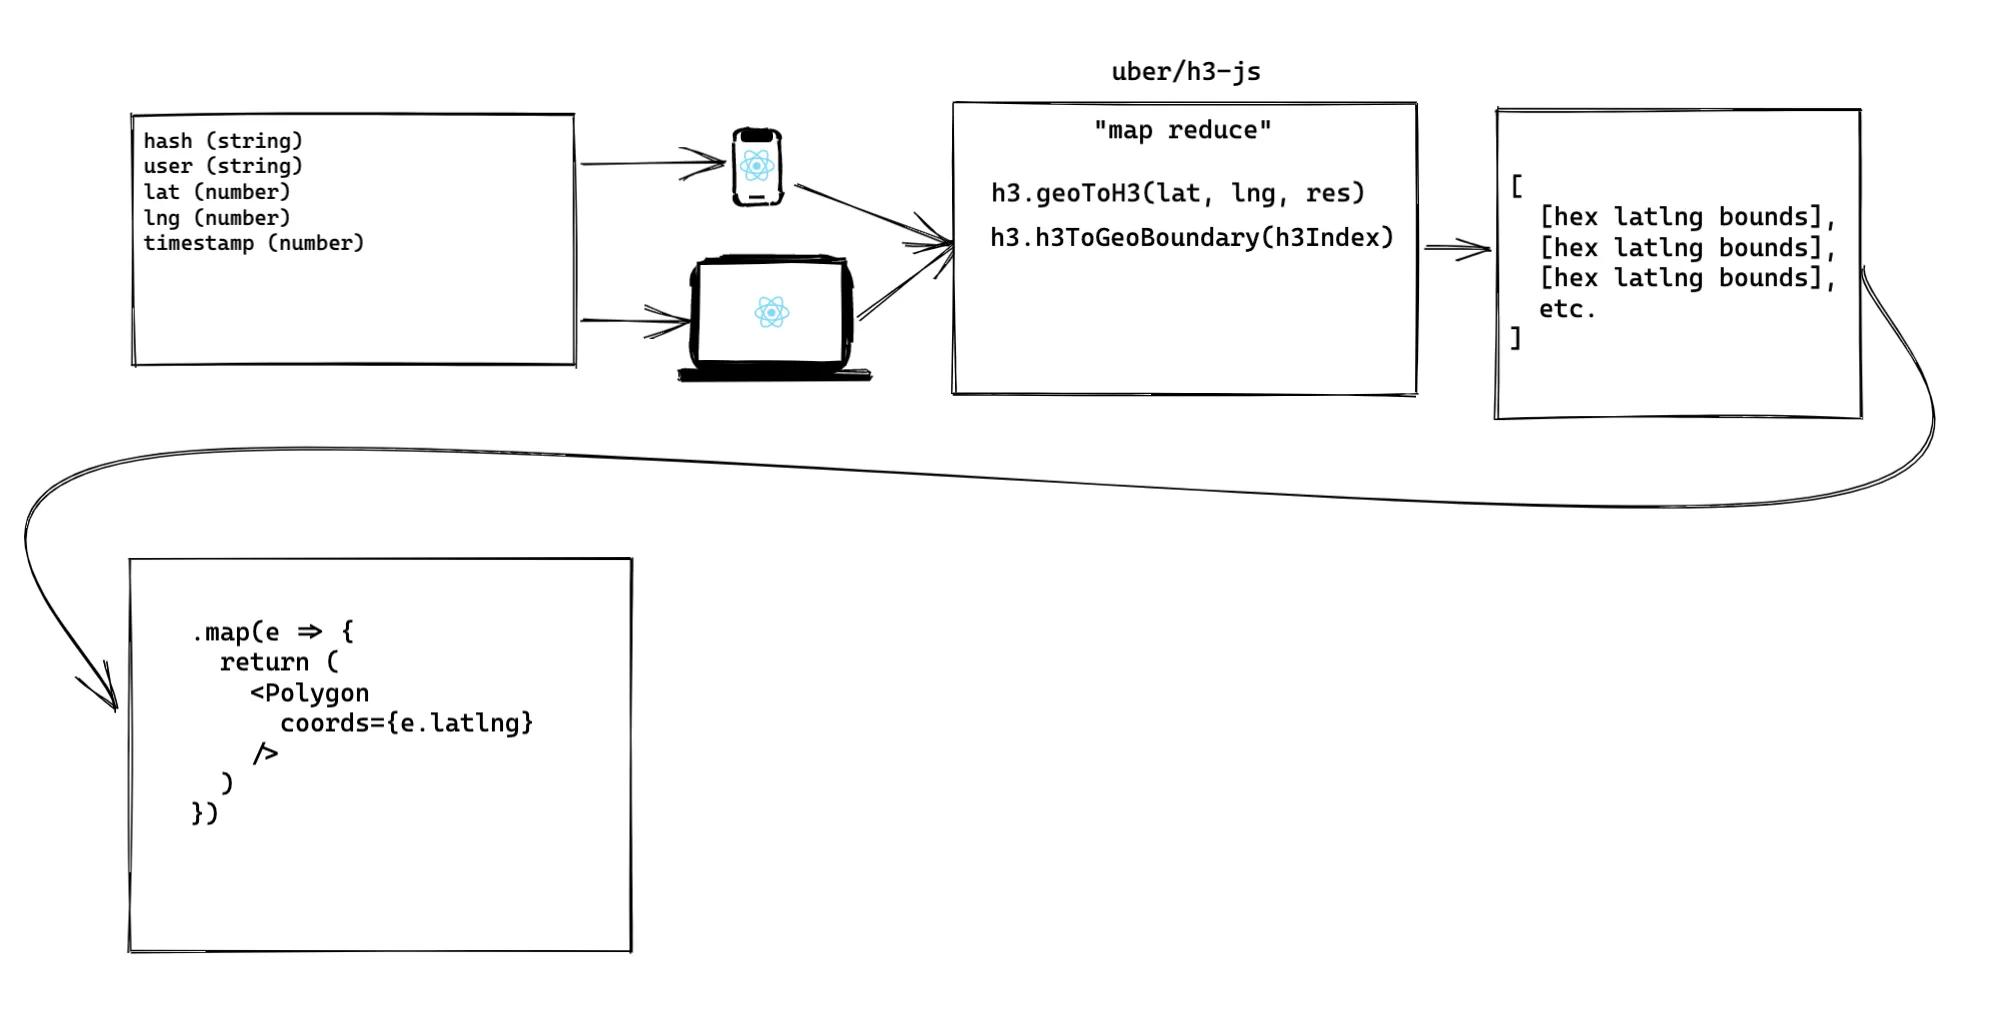
On the client, H3 groups lat/lng coordinates by h3 hash. I then do some extra logic to determine a heatmap color for each hexagon.
Additionally, for each unique hash, H3 can return the bounding coordinates at any given resolution (0-15). I use this to draw <Polygon>s
with react-native-maps and @react-google-maps/api.
Takeaways
Map-reducing a 5000 item JSON list into many <Polygon> components, at different H3 resolutions, resulted in a choked up UI.
useCallback and useMemo, where appropriate, resulted in some very perceivable UI rendering speed improvements.
The React-Native + Expo developer experience is pretty nice! I got up to speed and published an iOS build to Testflight in less than a week.
You can do sooo much with just TypeScript — write a mobile app, provision cloud infrastructure, write a cloud native backend.
It costs nearly $0 to deploy, maintain and run all of this... thank you Serverless AWS Resources! 😍
Testing and debugging iOS location permissions as well as background tasks was non-trivial.
The most difficult thing about this project was recreating Zenly's curved touch-zoom gesture animations (see very first image). And yes, it has nothing to do with "hexagonal geospatial timeseries data"... 🤷🏻♂️
Next Steps
I'd like get familiar with more of the H3 library methods. I only used a tiny fraction of it.
I'm also curious how the serverless backend would stand up to 100+ users simultaneously calling it multiple times per second.
Live Demo
To see the browser version of this project, head over to my Projects page!